
 NATIONFOLIO// PLANETARY INTELLIGENCE TERMINAL
- ✓Connecting to the data service6 official publishers
- ✓Loading countries and indicators220 countries · 139 indicators
- ✓Loading the map layerGDP per capita (PPP)
- ◌Building the 3D globe

See Planet Earth in Numbers,
Not Just Political Borders.
An open terminal for country statistics. Explore 139 indicators for 220 countries and territories, straight from 6 official publishers: World Bank, IMF, OECD, BIS, Eurostat and UN Comtrade. A 3D globe, trade arcs, IMF projections and a resilience score you can audit, with the source next to every number.
What's inside
A globe coloured by official data, trade partners drawn as arcs, IMF projections, a resilience score with a published formula, and automated checks on every value.
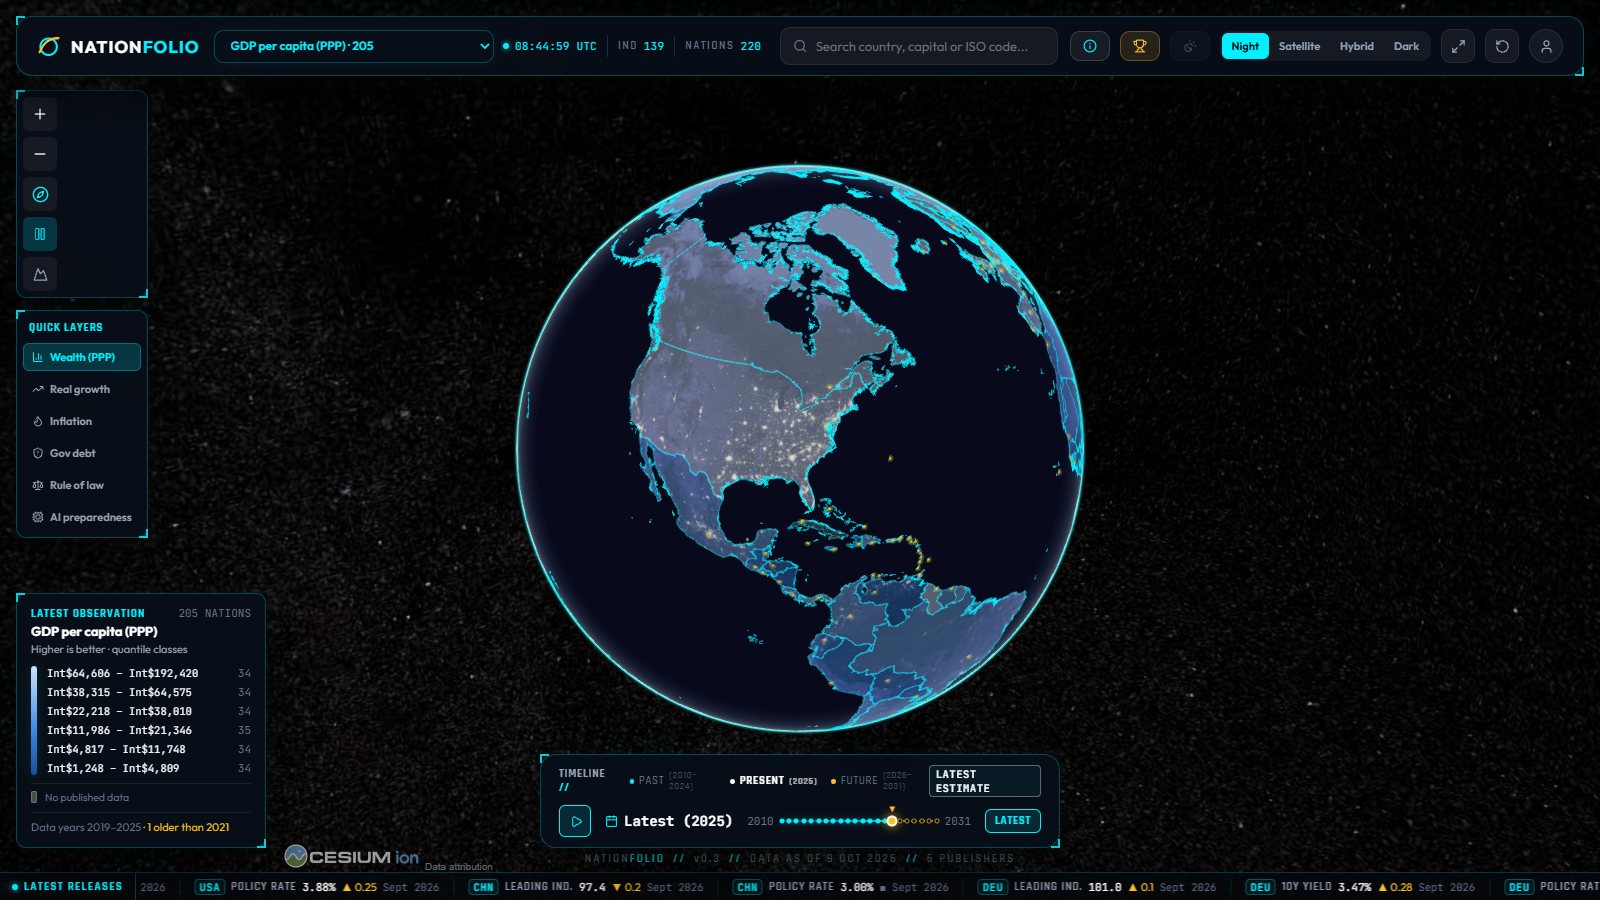
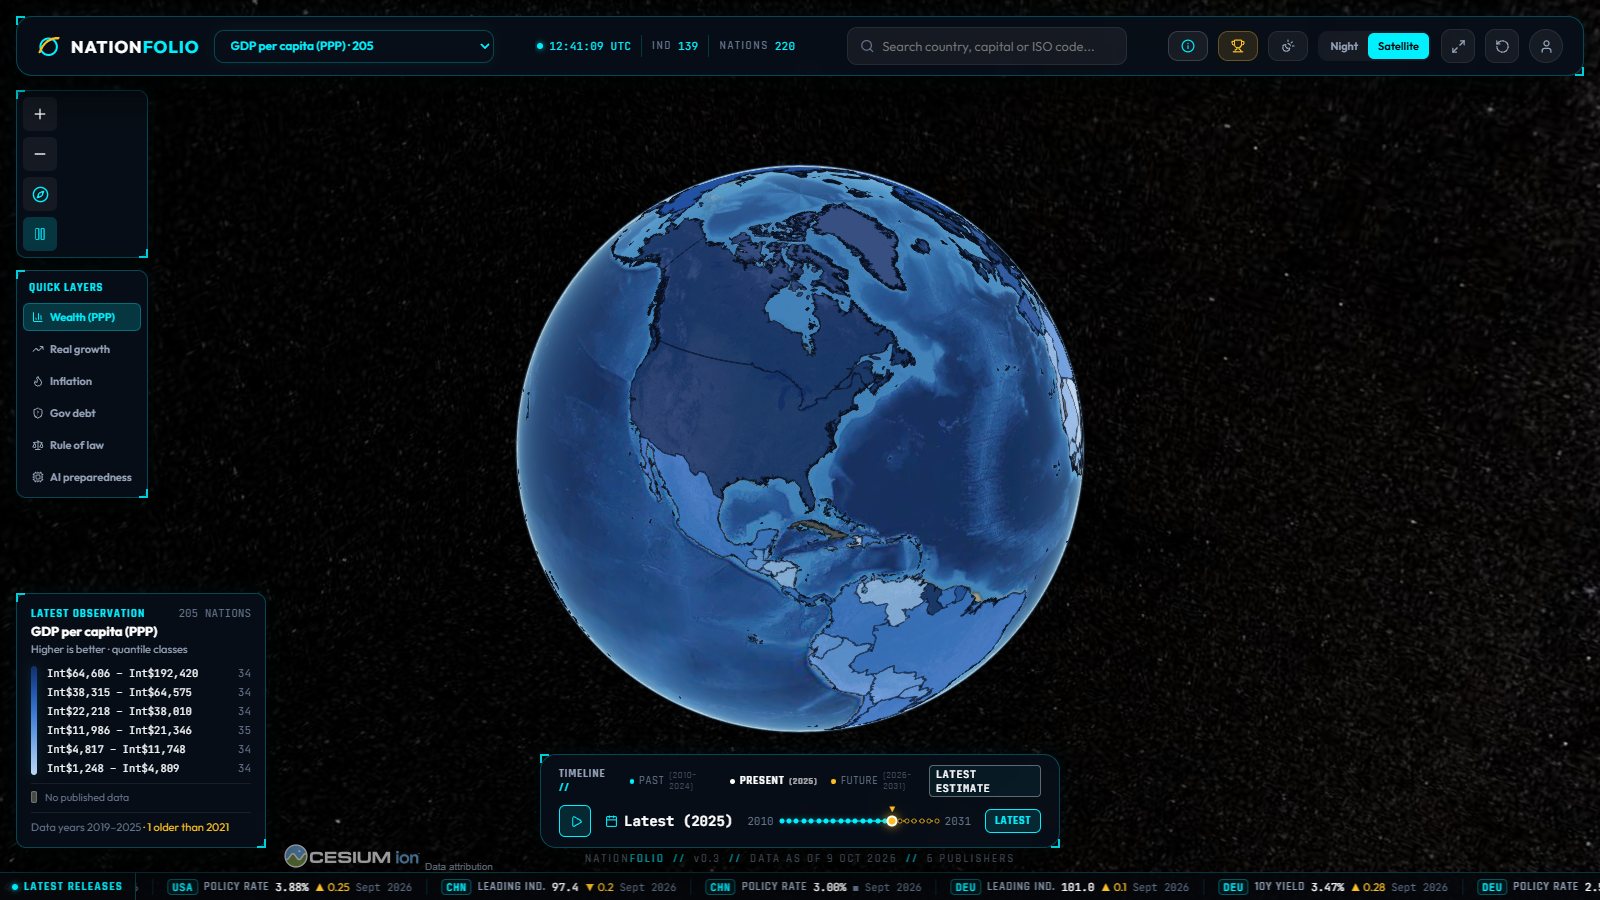
A 3D globe coloured by official data
Colours are quantile classes: six equal-sized groups of countries, so a few extreme values (a tax haven, an oil exporter) cannot wash out the rest of the map. Regional and income-group aggregates never enter the classes.
AI preparedness, as the IMF measures it
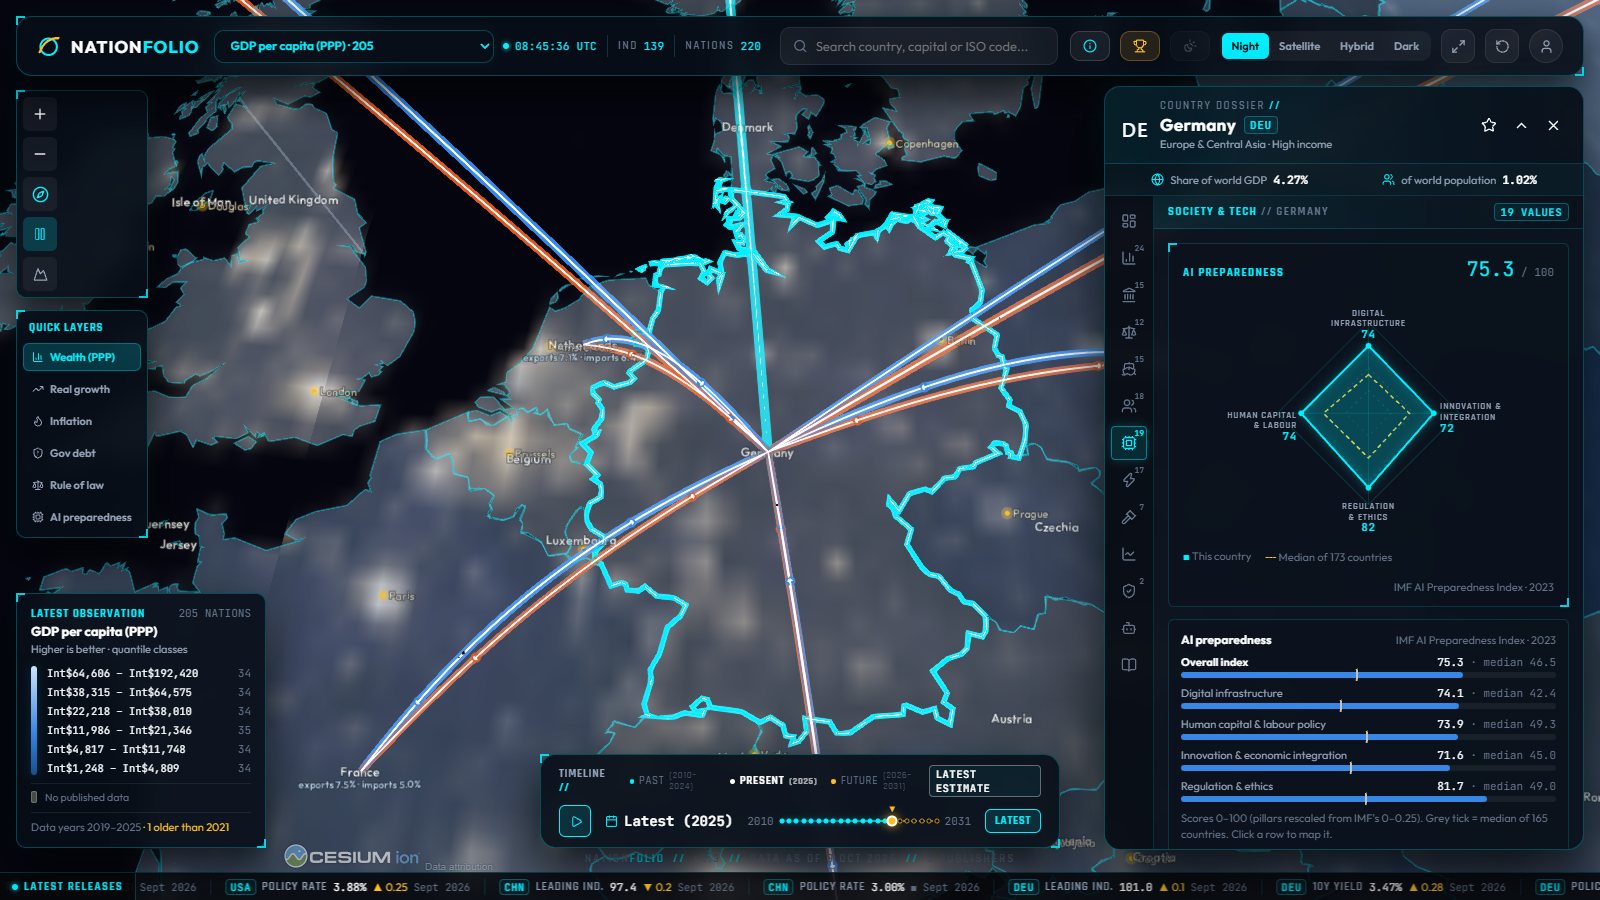
How ready each country is for AI, as the IMF measures it: four pillars (digital infrastructure, human capital and labour-market policy, innovation and economic integration, regulation and ethics), each drawn against the median country, next to World Bank R&D spending (% of GDP).
Who trades with whom
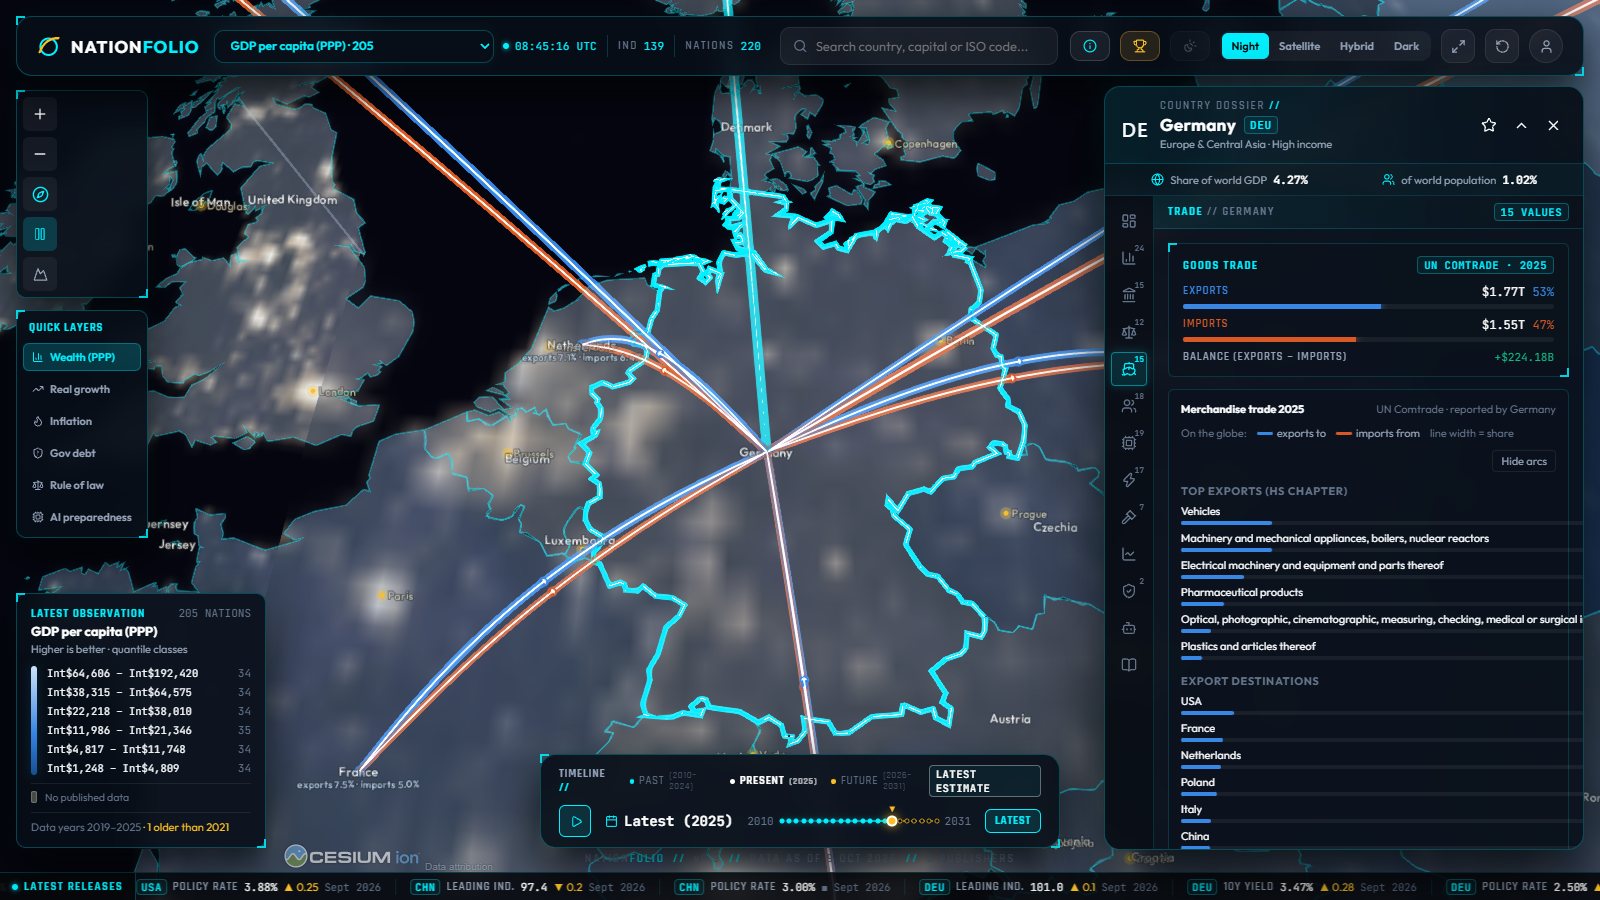
Goods exports and imports as each country reports them to UN Comtrade: the main products (HS chapters), the main partners drawn as arcs on the globe, and how concentrated exports are, as a Herfindahl–Hirschman index NationFolio computes from those figures.
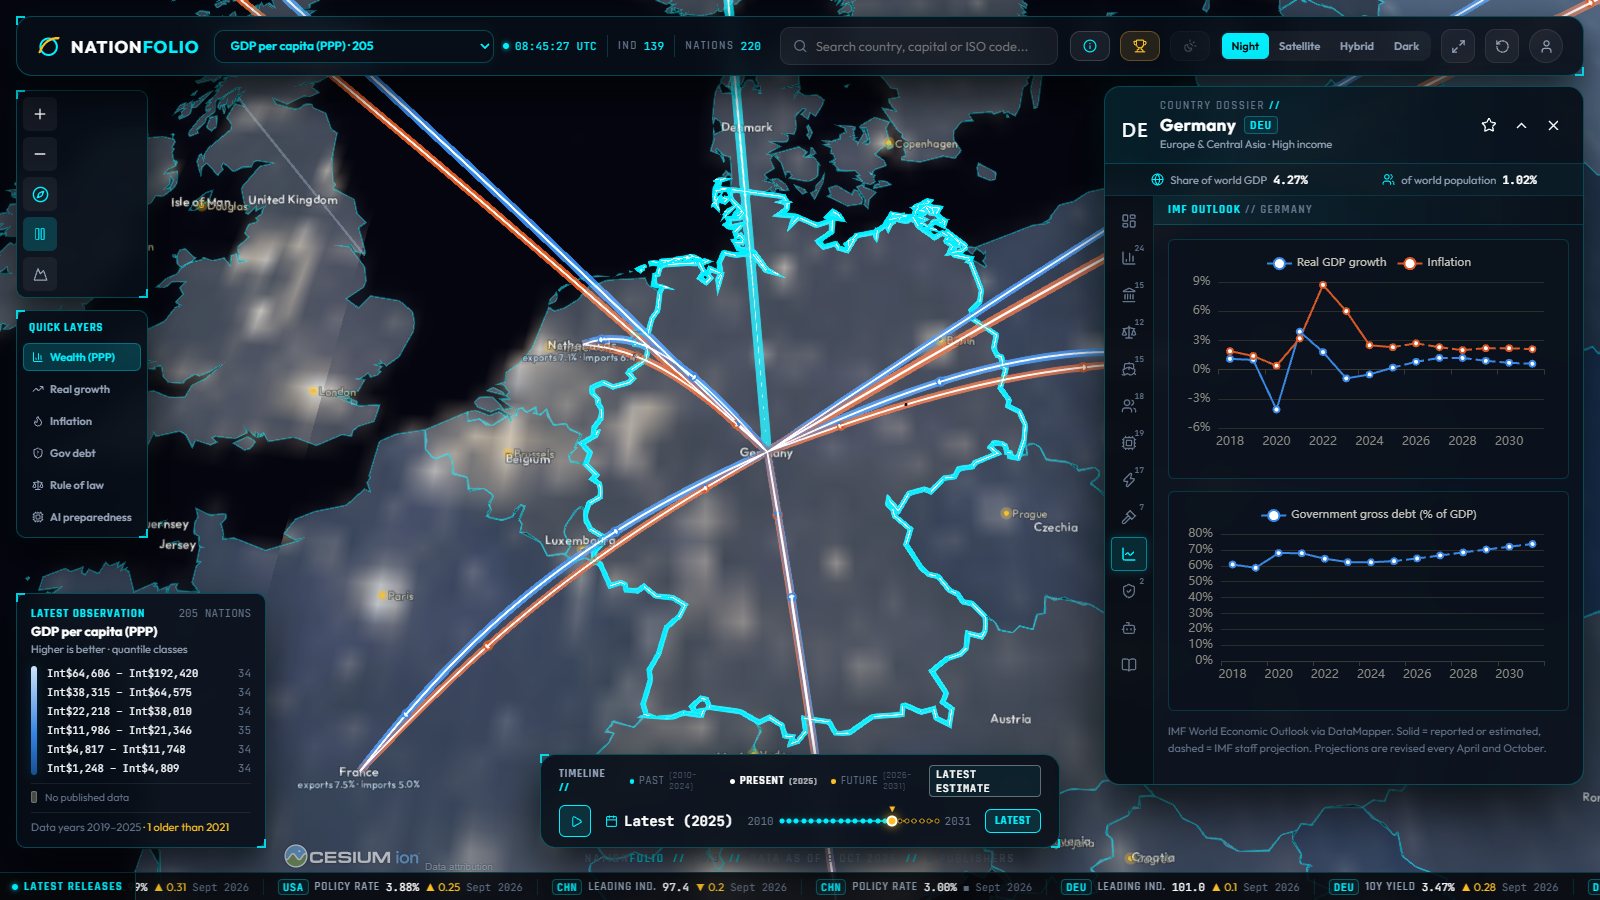
IMF projections to 2031
Real GDP growth, inflation and government debt from the IMF World Economic Outlook: solid lines are reported or estimated values, dashed lines are the IMF staff projections, revised every April and October.
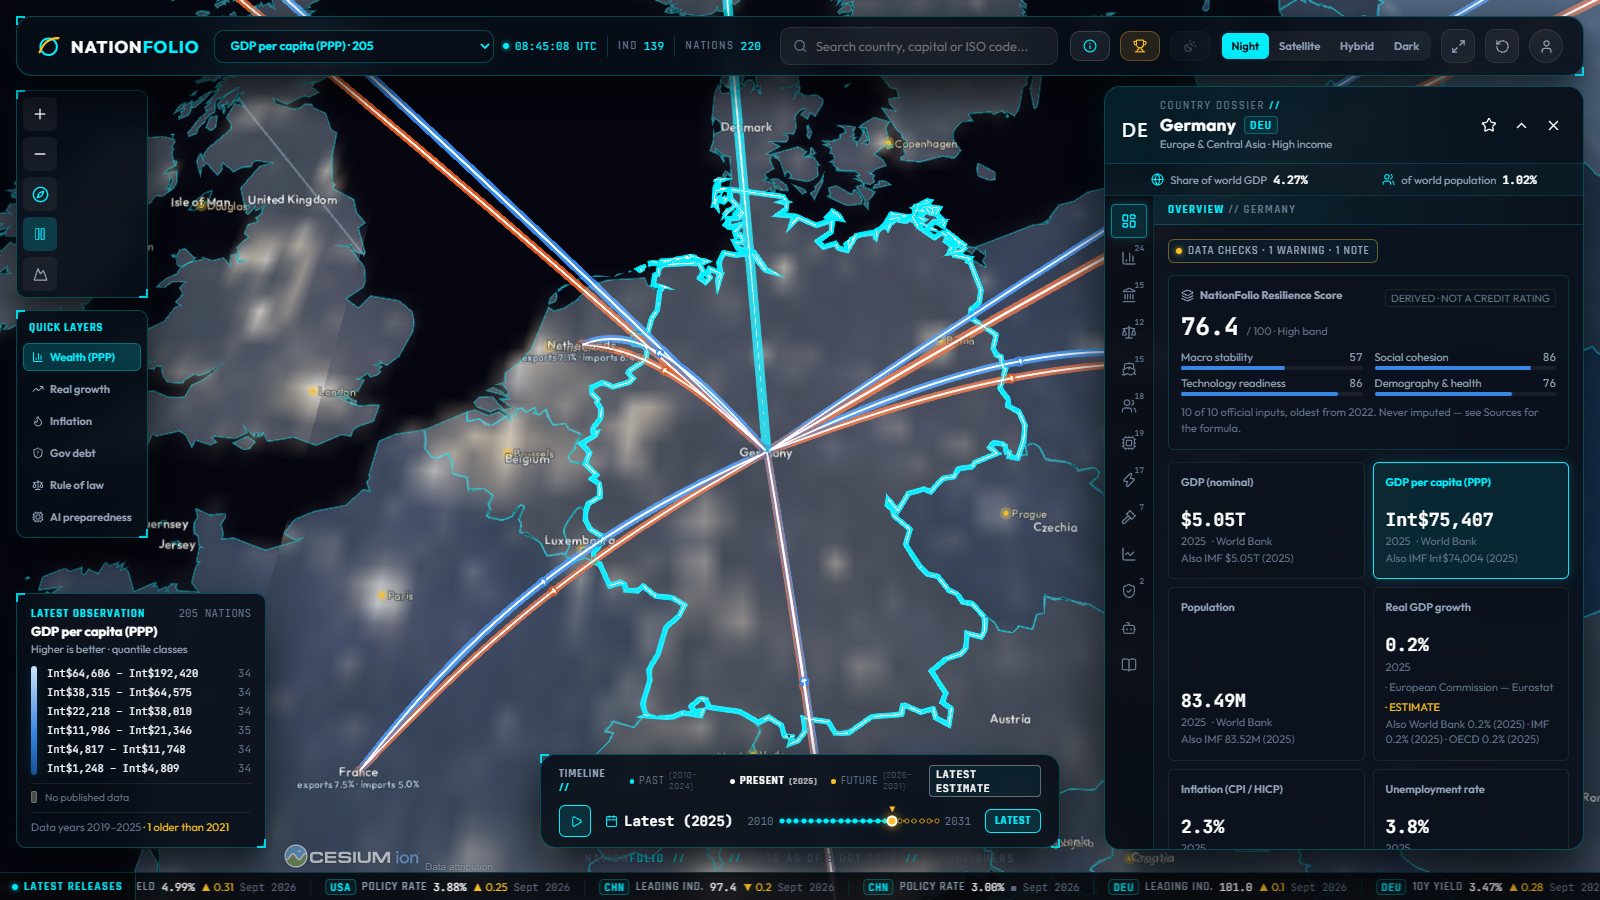
A resilience score you can audit
A score NationFolio derives from 10 official inputs in four areas (macro stability, social cohesion, technology readiness, demography and health). It is published only when at least 8 inputs exist, and is stored with its inputs and formula. Explicitly labelled in every dossier: derived index, not a credit rating.
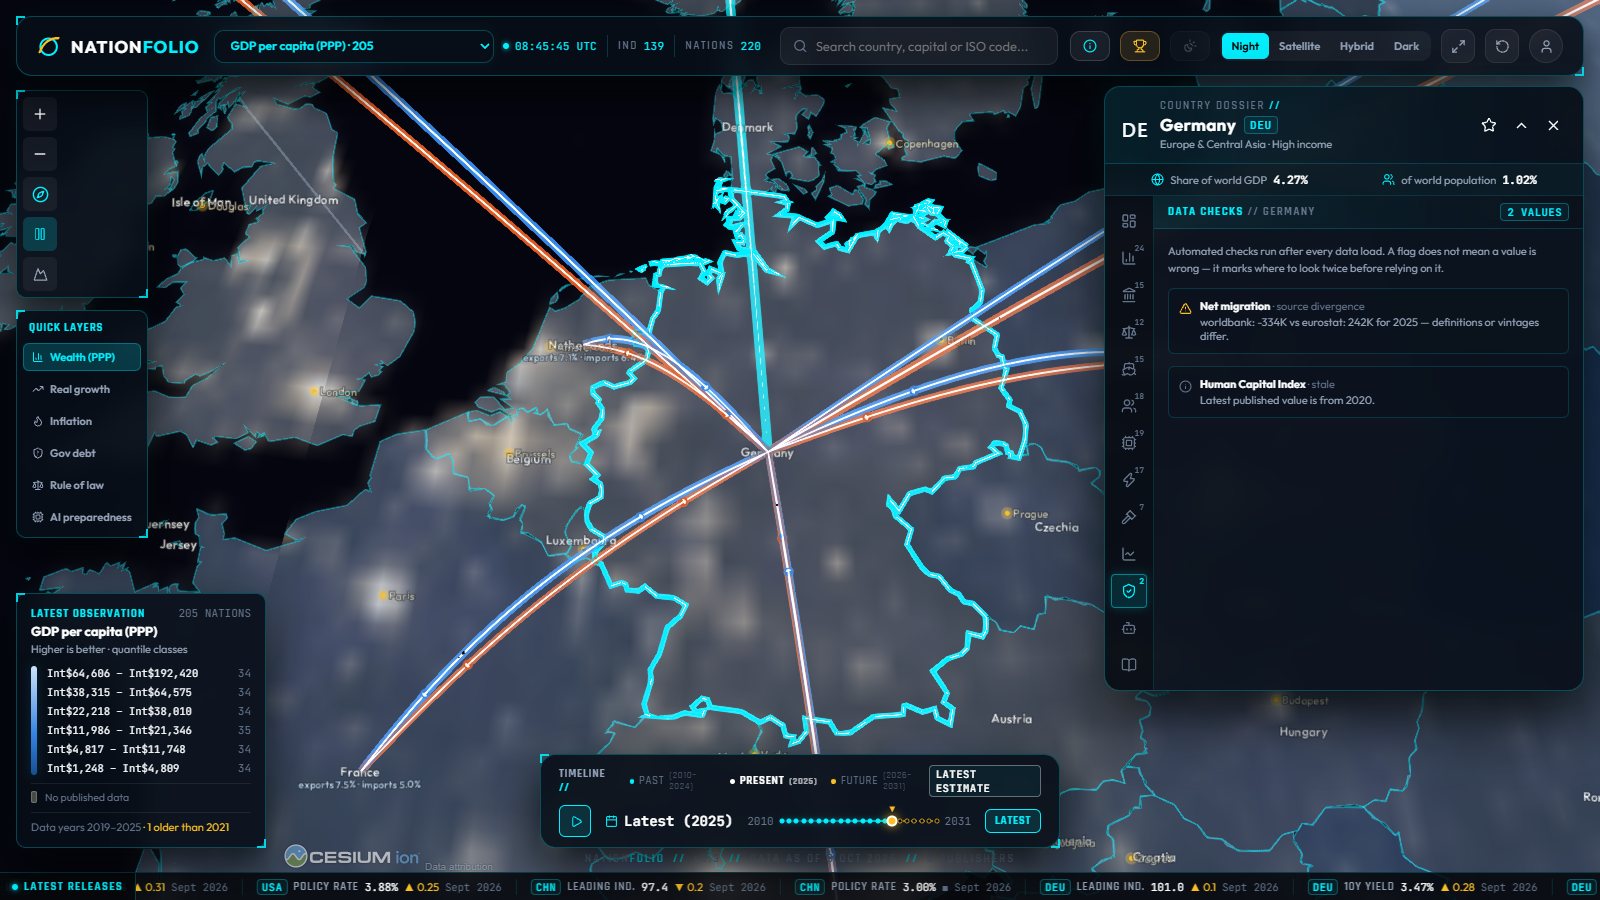
Automated Data Integrity Checks
After every data load, NationFolio runs five automated checks across every series:
Flags never change a value; they appear in each country's Data checks tab.
Six official publishers
Every value keeps its publisher, series, year and status, and every publisher response is stored exactly as downloaded. All six publish open data; only UN Comtrade asks for a free key.
Macroeconomic accounts, external debt stock, national poverty headcount, Gini inequality, R&D intensity (% GDP), education, and worldwide governance indicators.
World Economic Outlook (history and five-year staff projections), Fiscal Monitor, Global Debt Database, AI Preparedness Index, monthly consumer prices, bank soundness indicators and reserves.
GDP growth, consumer prices and harmonised unemployment (shown next to the other publishers), 10-year government bond yields and composite leading indicators.
Central bank policy rates, credit to the private non-financial sector, credit-to-GDP gaps, debt service ratios, and residential real property indices.
Harmonised consumer prices (HICP), unemployment, government debt and deficit (EDP), GDP growth, migration and renewable energy, for EU and EFTA countries.
Merchandise exports and imports by product (HS chapter) and partner country. NationFolio derives export-concentration indices from them.
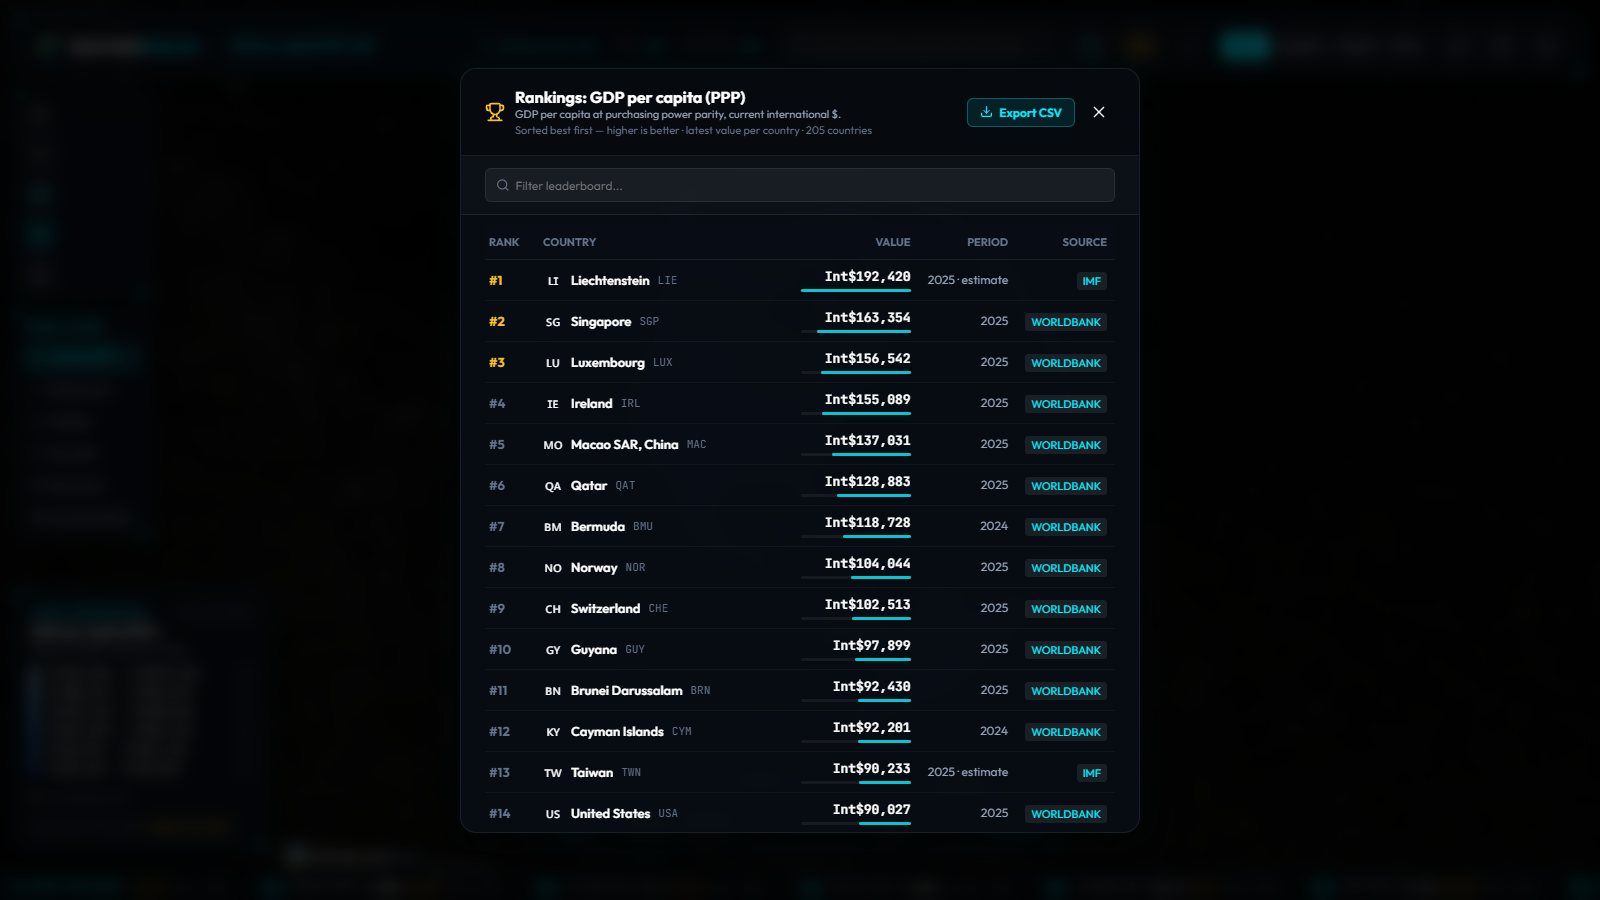
Rankings and CSV export
Rank every country with a published value for any indicator: best first where the indicator has a direction, largest first where it has none. Export the list as CSV with rank, country, value, year, publisher and status.
AI briefs on your own computer
When you run NationFolio on your own computer, it can write a country briefing with the model you have loaded in LM Studio, using only the figures in the dossier. Prompts stay on your machine and there is no per-request cost. The hosted version does not include it.